


Dashboards
Beta
The
pipeline
 you
you
can finally trust
Dashboards turn your CRM into live numbers, giving busy leaders the what and your team the why: pipeline, wins, win rate and forecast in one view.
Reports on
01
The number and the reason, together
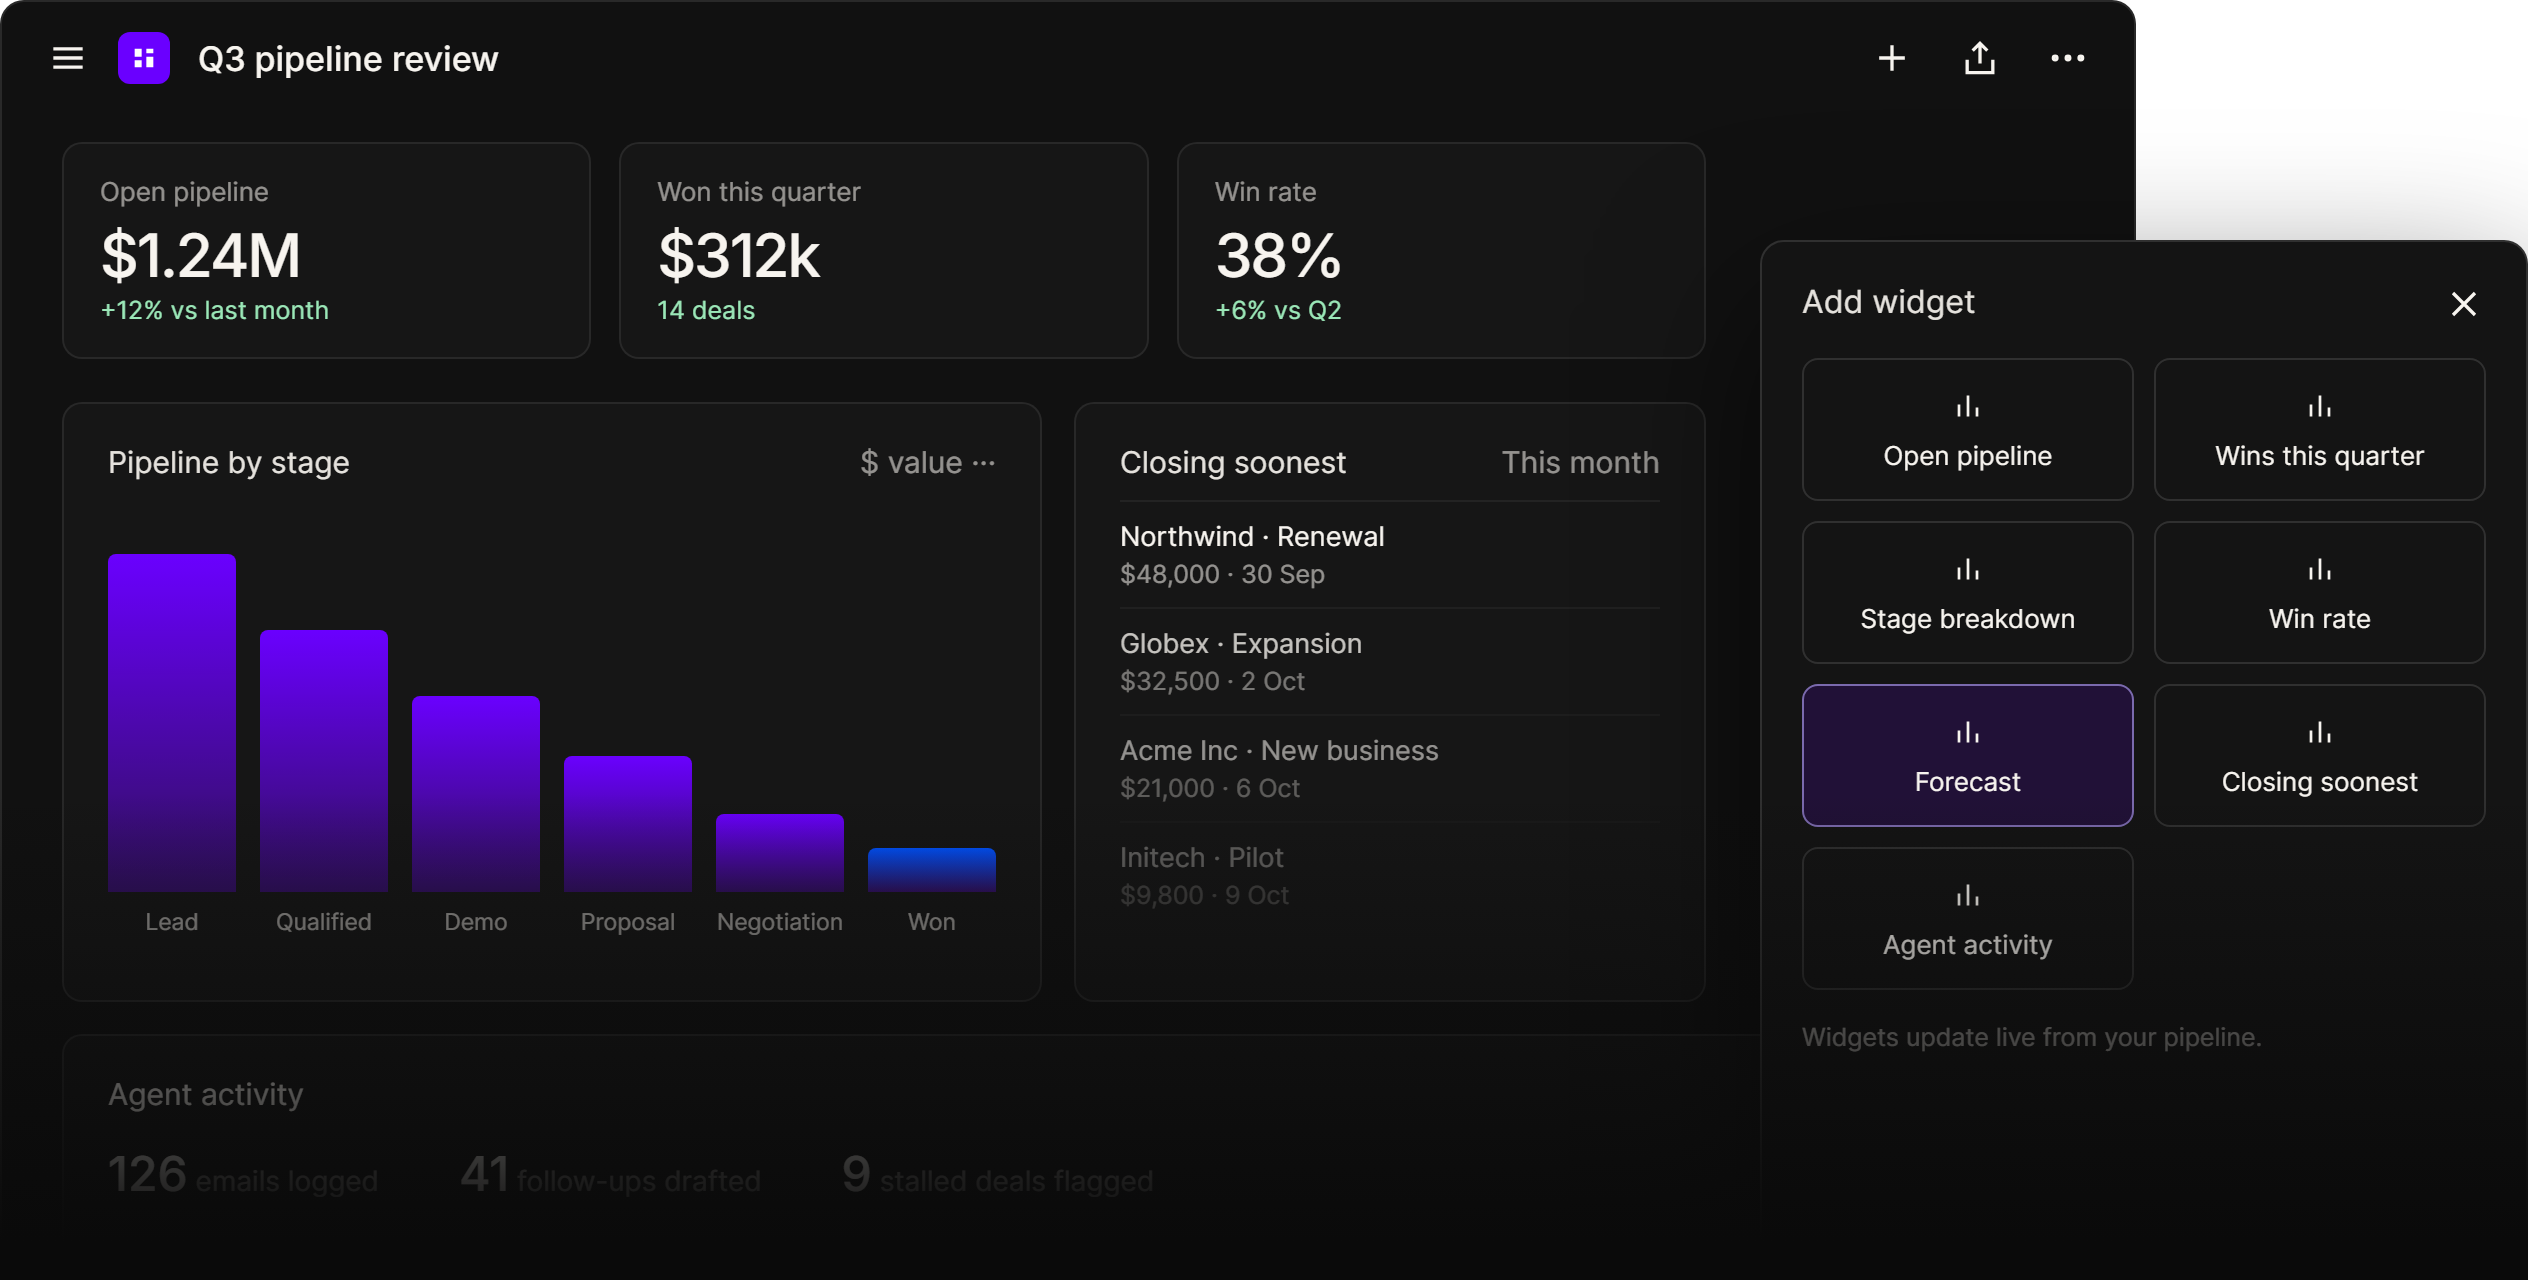
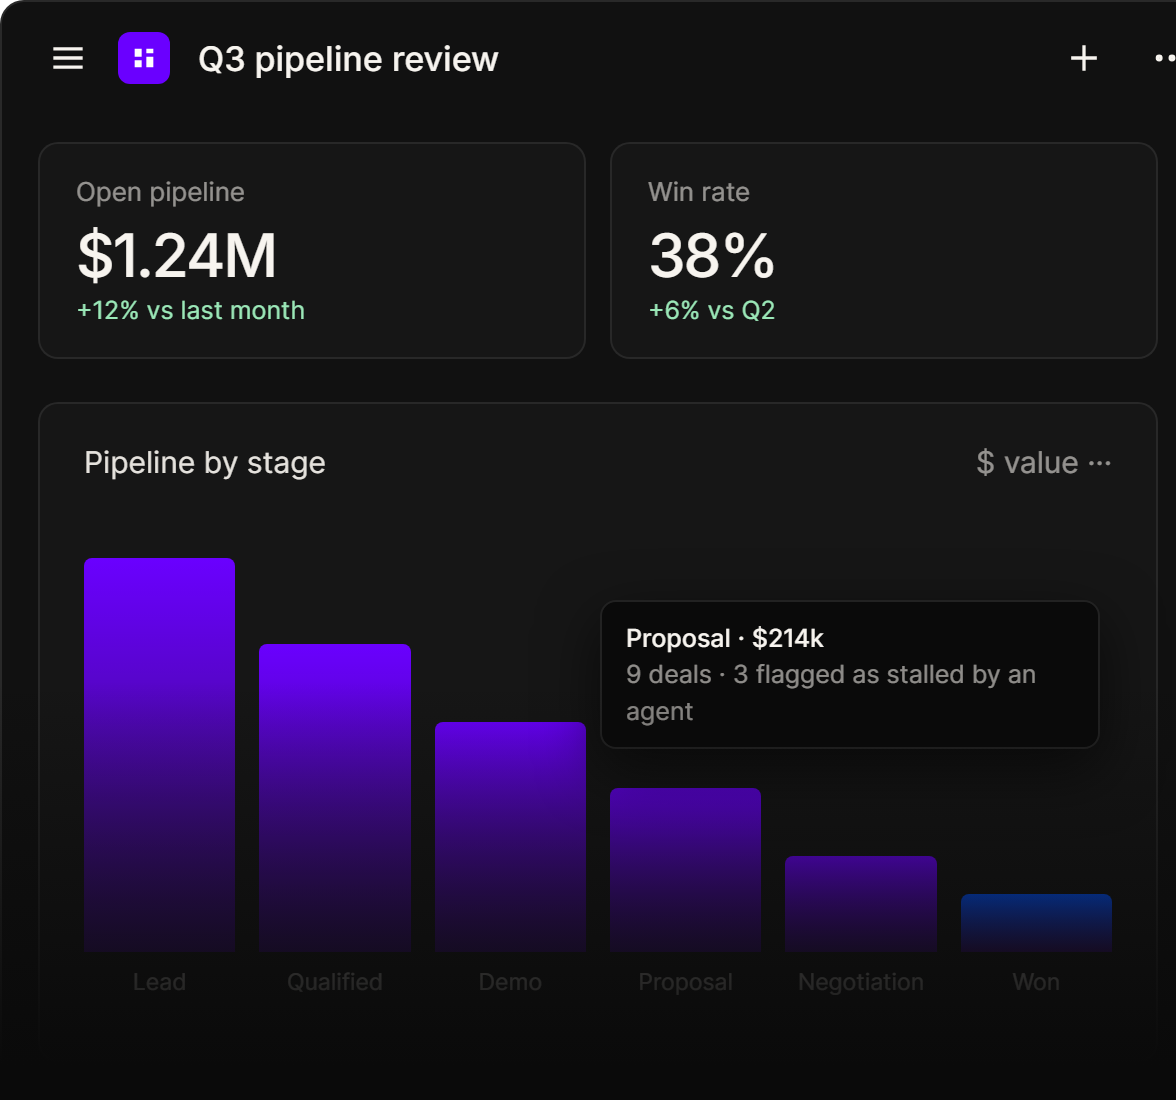
Open pipeline, win rate and forecast update live, traced back to the deals and conversations behind them. Read the number, and the reason it moved.
02
Agents watch the numbers
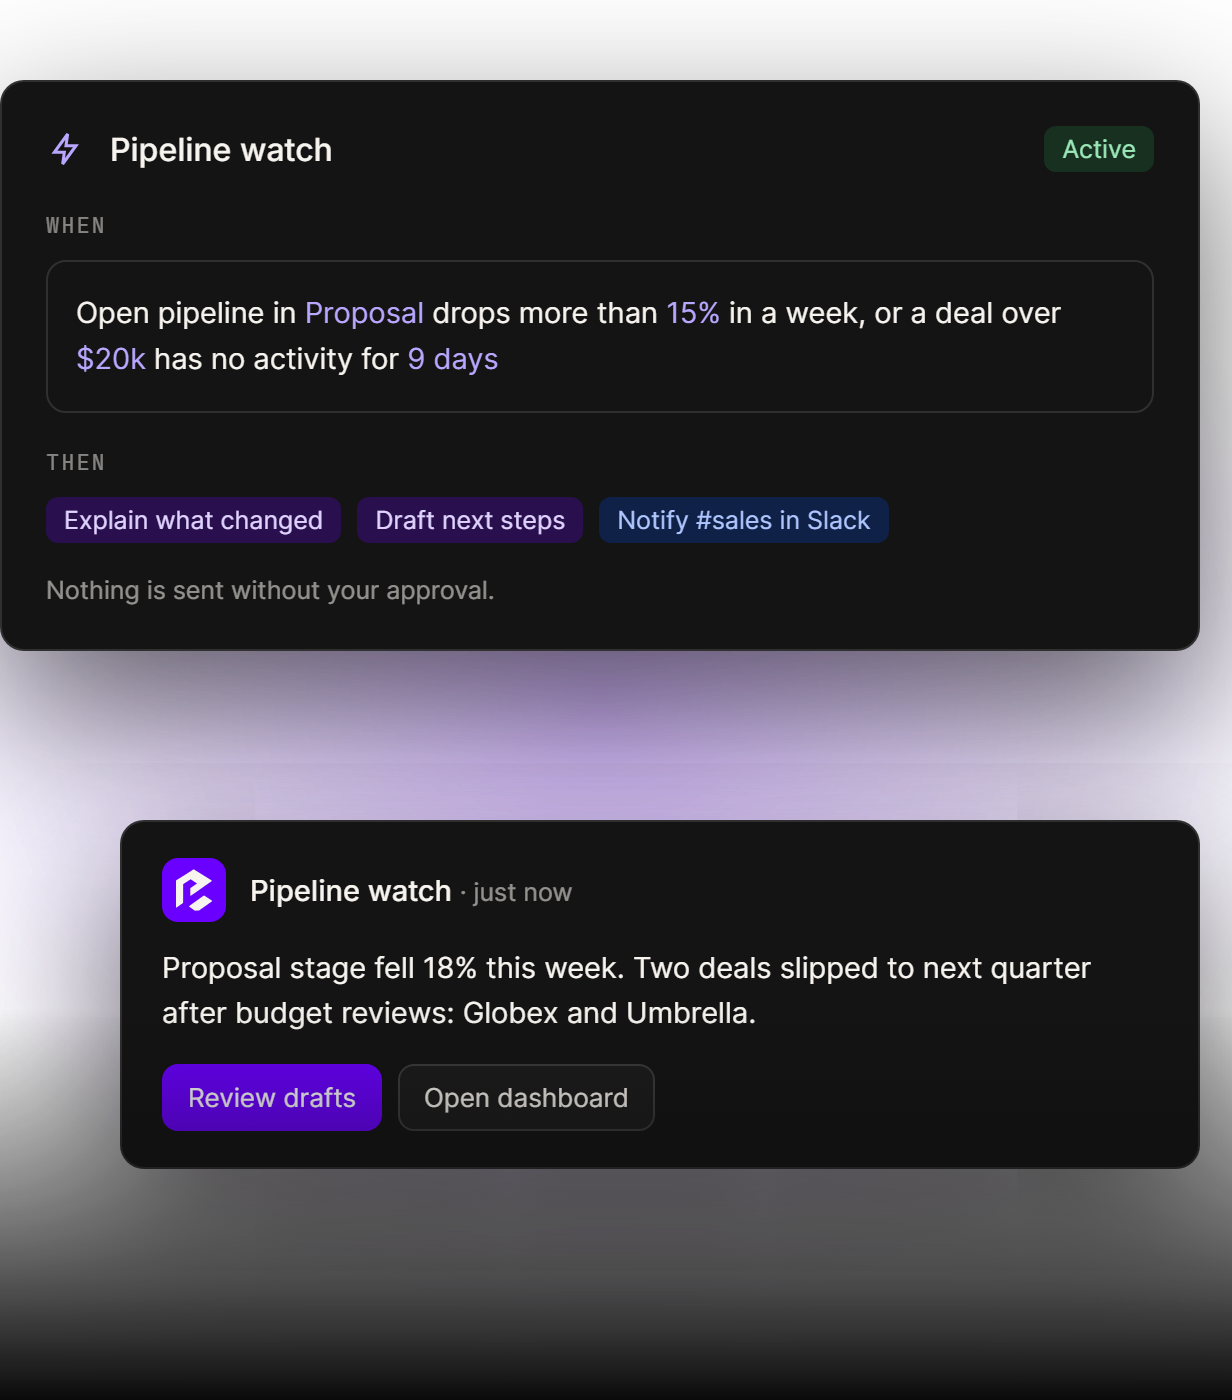
The moment a metric crosses your threshold, an agent explains what changed and drafts next steps, before you have even opened the dashboard.
03
The executive view your leaders need
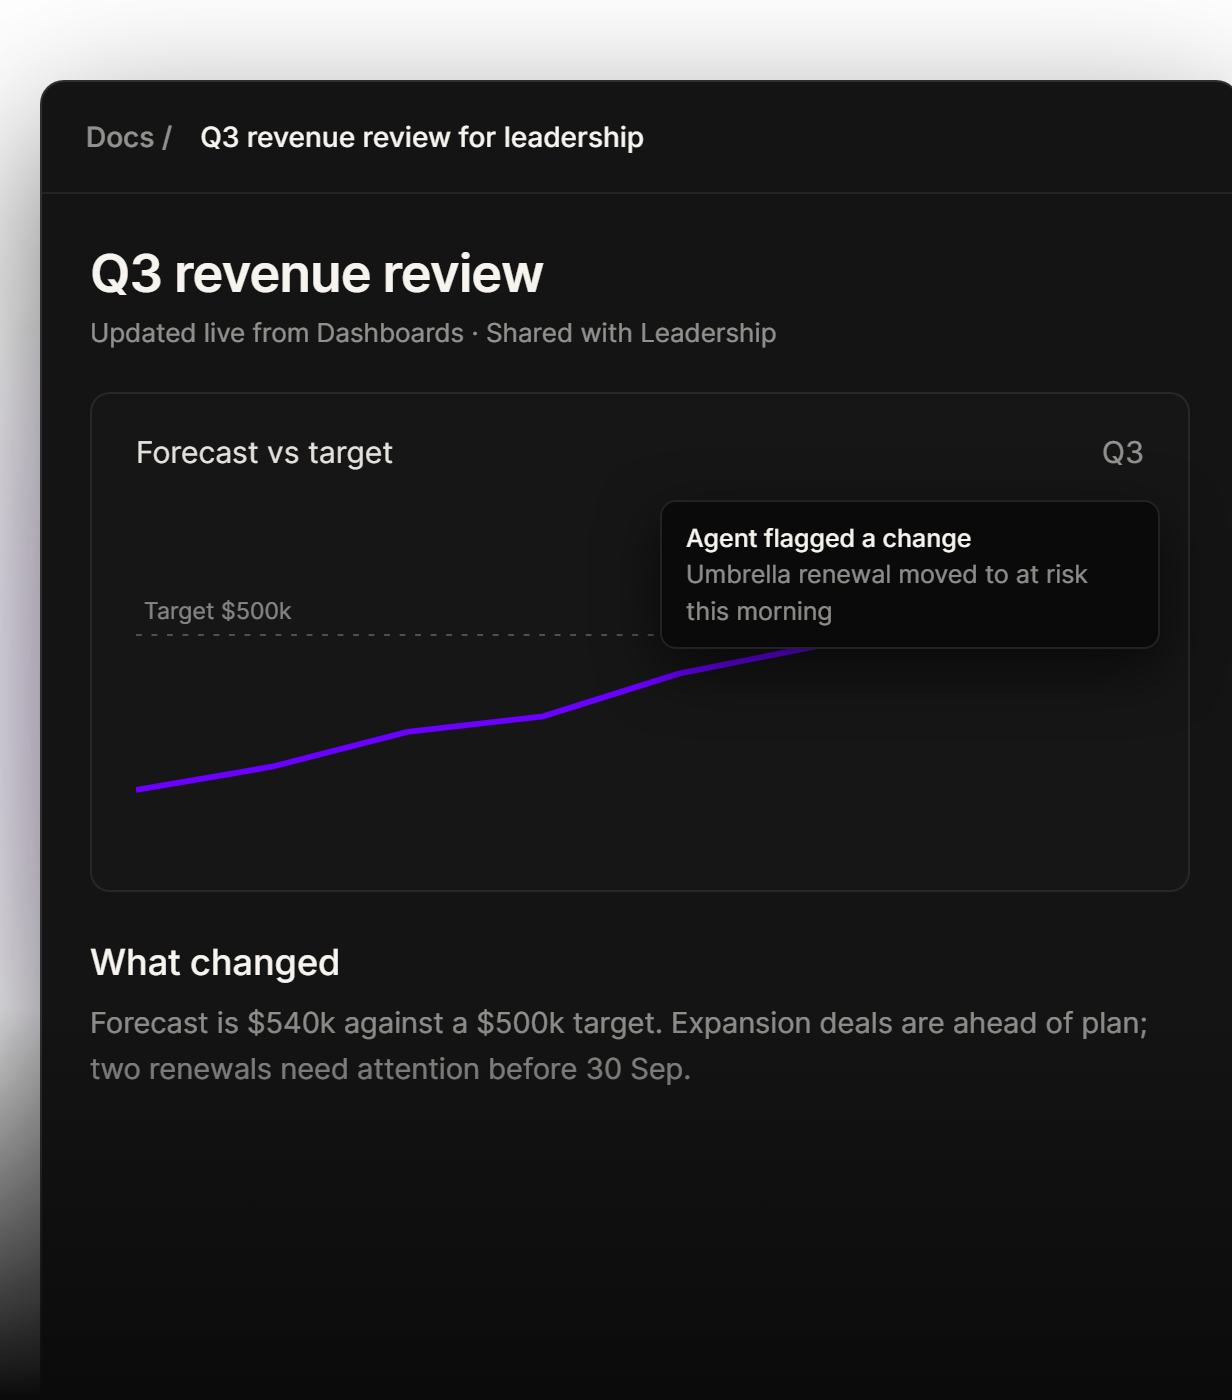
Dashboards live inside Docs for a single, clean view of the quarter. When something shifts an agent flags it, so leadership never has to dig for what changed.
04
Ask the follow-up question
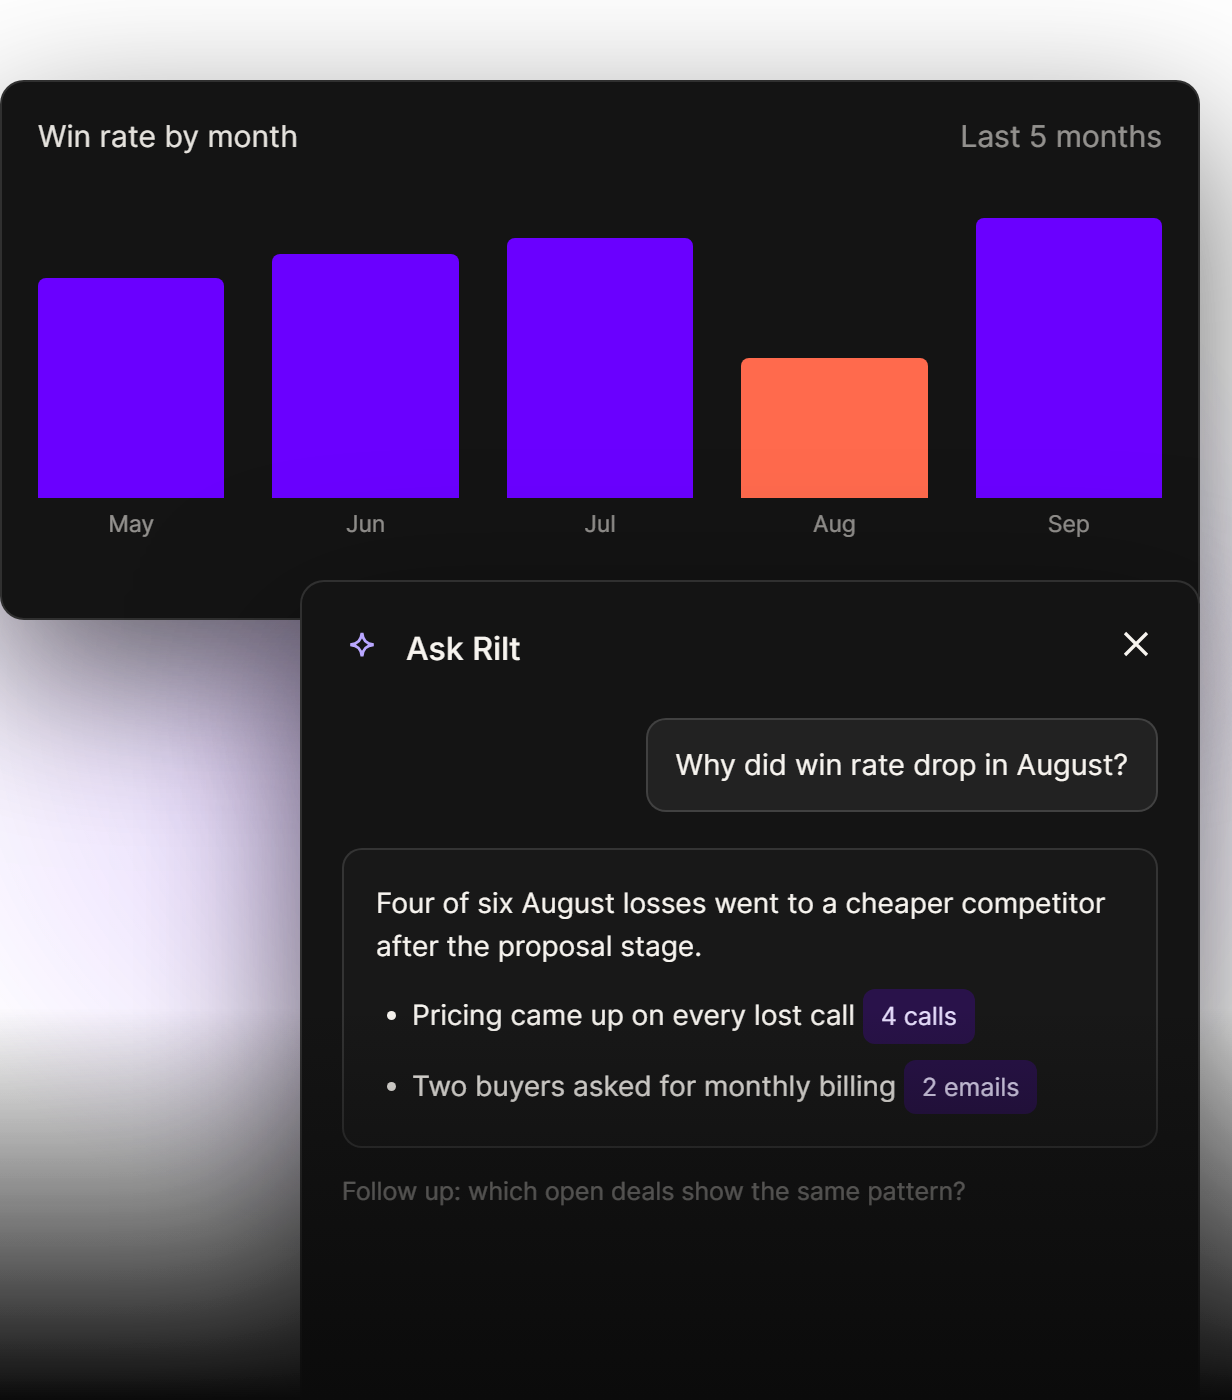
Ask Rilt why a number moved, slice by owner, stage or segment in plain language, then hand the answer straight to an agent to follow up or route to the right rep.
01
The number and the reason, together
Open pipeline, win rate and forecast update live, traced back to the deals and conversations behind them. Read the number, and the reason it moved.
02
Agents watch the numbers
The moment a metric crosses your threshold, an agent explains what changed and drafts next steps, before you have even opened the dashboard.
03
The executive view your leaders need
Dashboards live inside Docs for a single, clean view of the quarter. When something shifts an agent flags it, so leadership never has to dig for what changed.
04
Ask the follow-up question
Ask Rilt why a number moved, slice by owner, stage or segment in plain language, then hand the answer straight to an agent to follow up or route to the right rep.
Dashboards for

Pipeline reviews
See open pipeline by stage and owner every week, with the deals that moved and why. Run the pipeline meeting from one live view, not a spreadsheet export.

Forecasting

Leadership reporting

Sales and CS alignment

Drill-in and zoom out
Built to scale with
your team
Customizable, role-aware and shareable with anyone in your workspace.
Suggested on creation
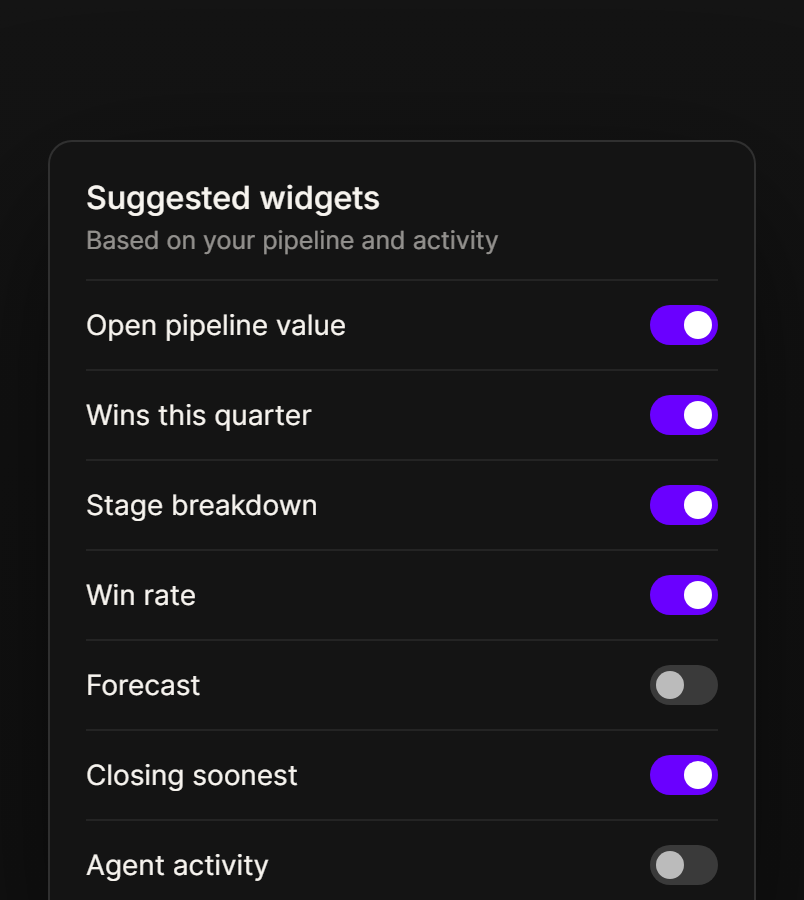
Rilt looks at your pipeline when you create a dashboard and suggests the widgets that fit your data.
The widgets you need
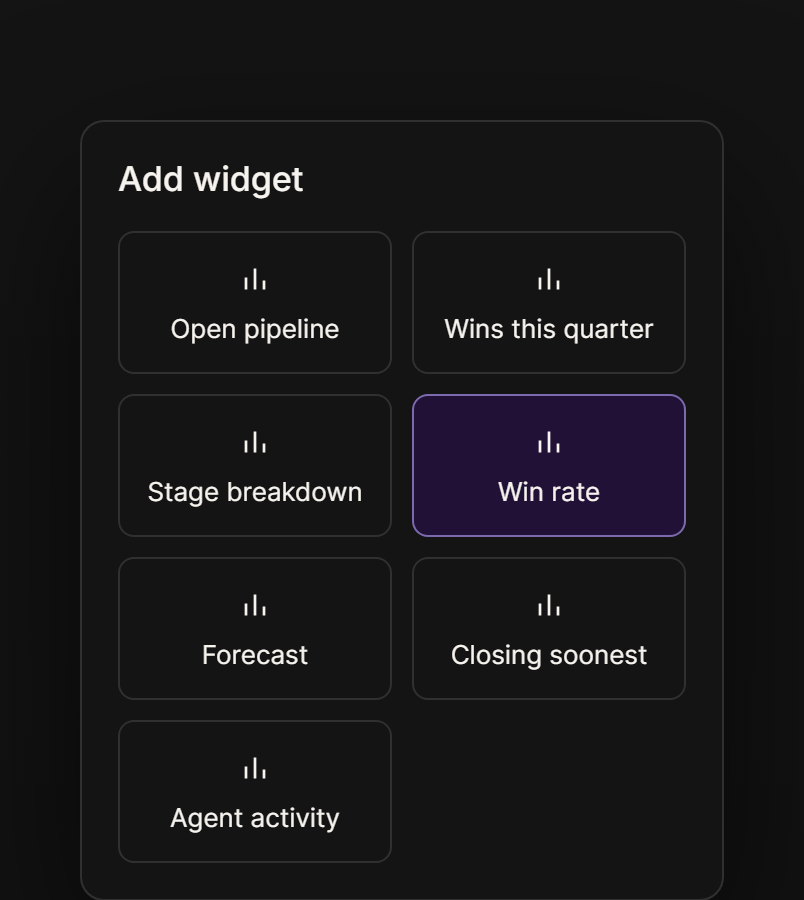
Open pipeline, wins, stage breakdown, win rate, forecast, deals closing soonest and agent activity.
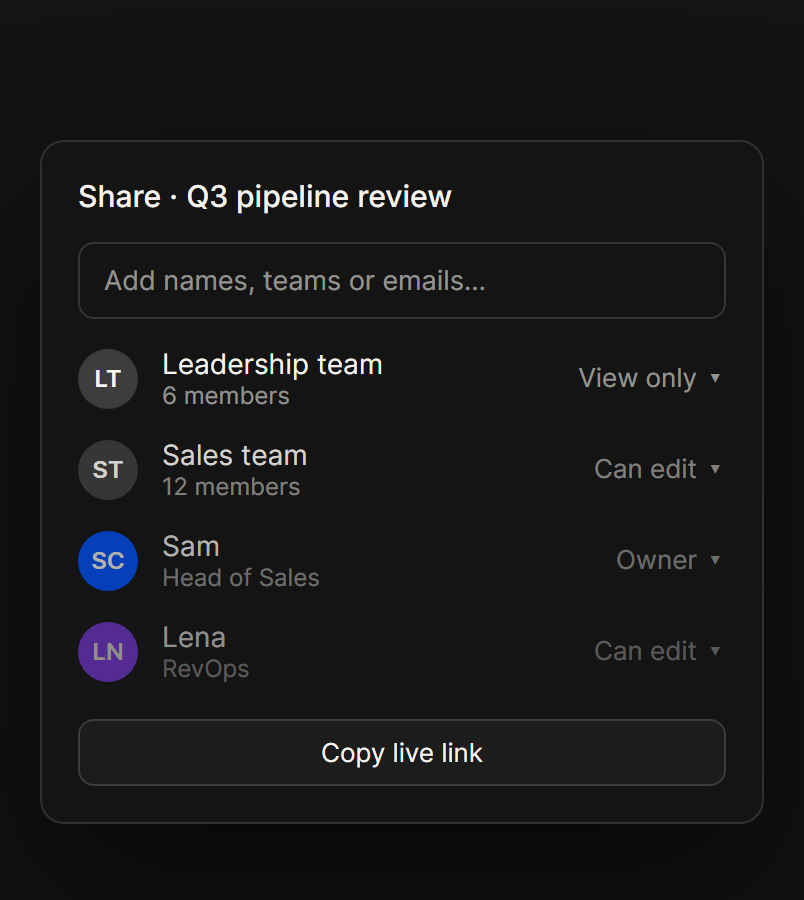
Share with leadership
Share a live dashboard with anyone in your workspace, so leadership sees the same numbers as the team.
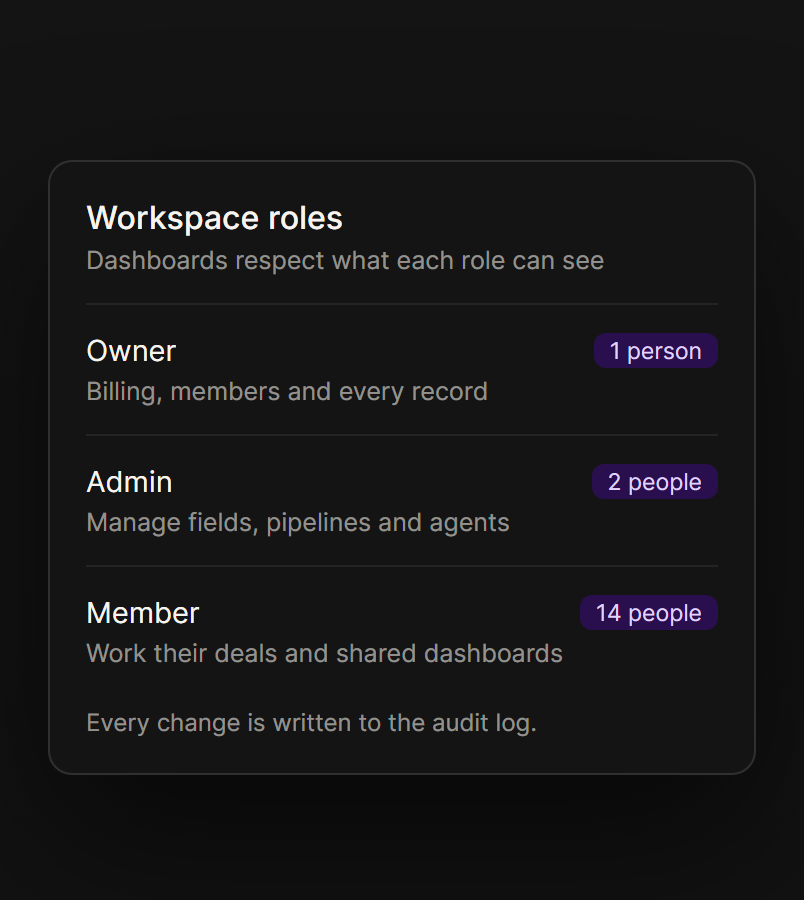
Role-based access
Dashboards follow Owner, Admin and Member roles automatically, so people only see what they are allowed to.
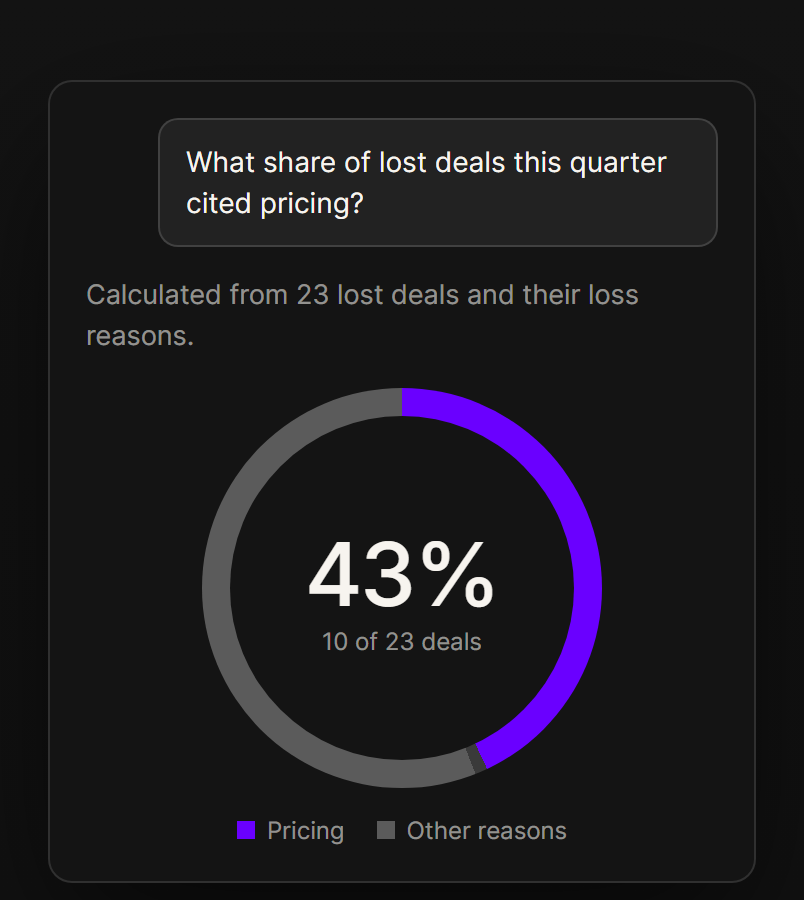
From question to chart, instantly
Ask Rilt a question about your pipeline and get a real calculation and chart back, built as fast as you can ask it.
Get
 more
more
from your numbers
The real value isn’t in the report. It’s in what you do with it next.
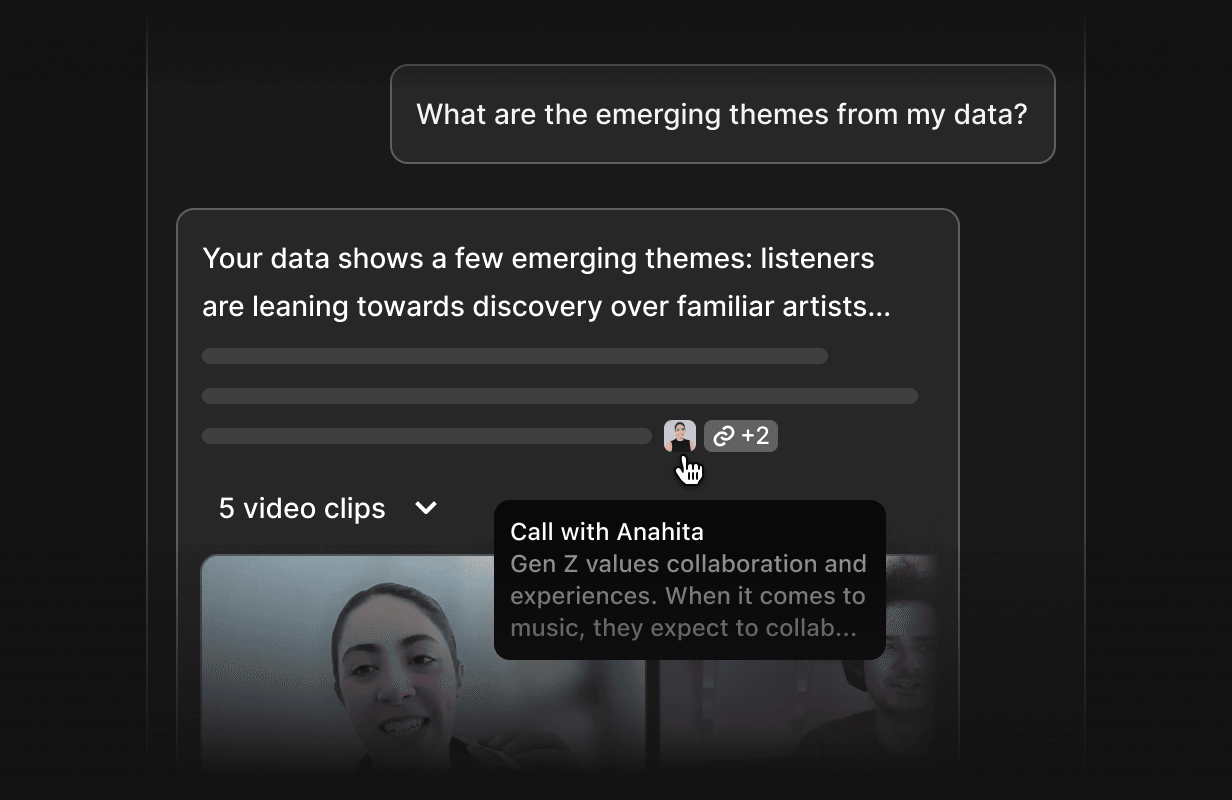
 Ask Rilt
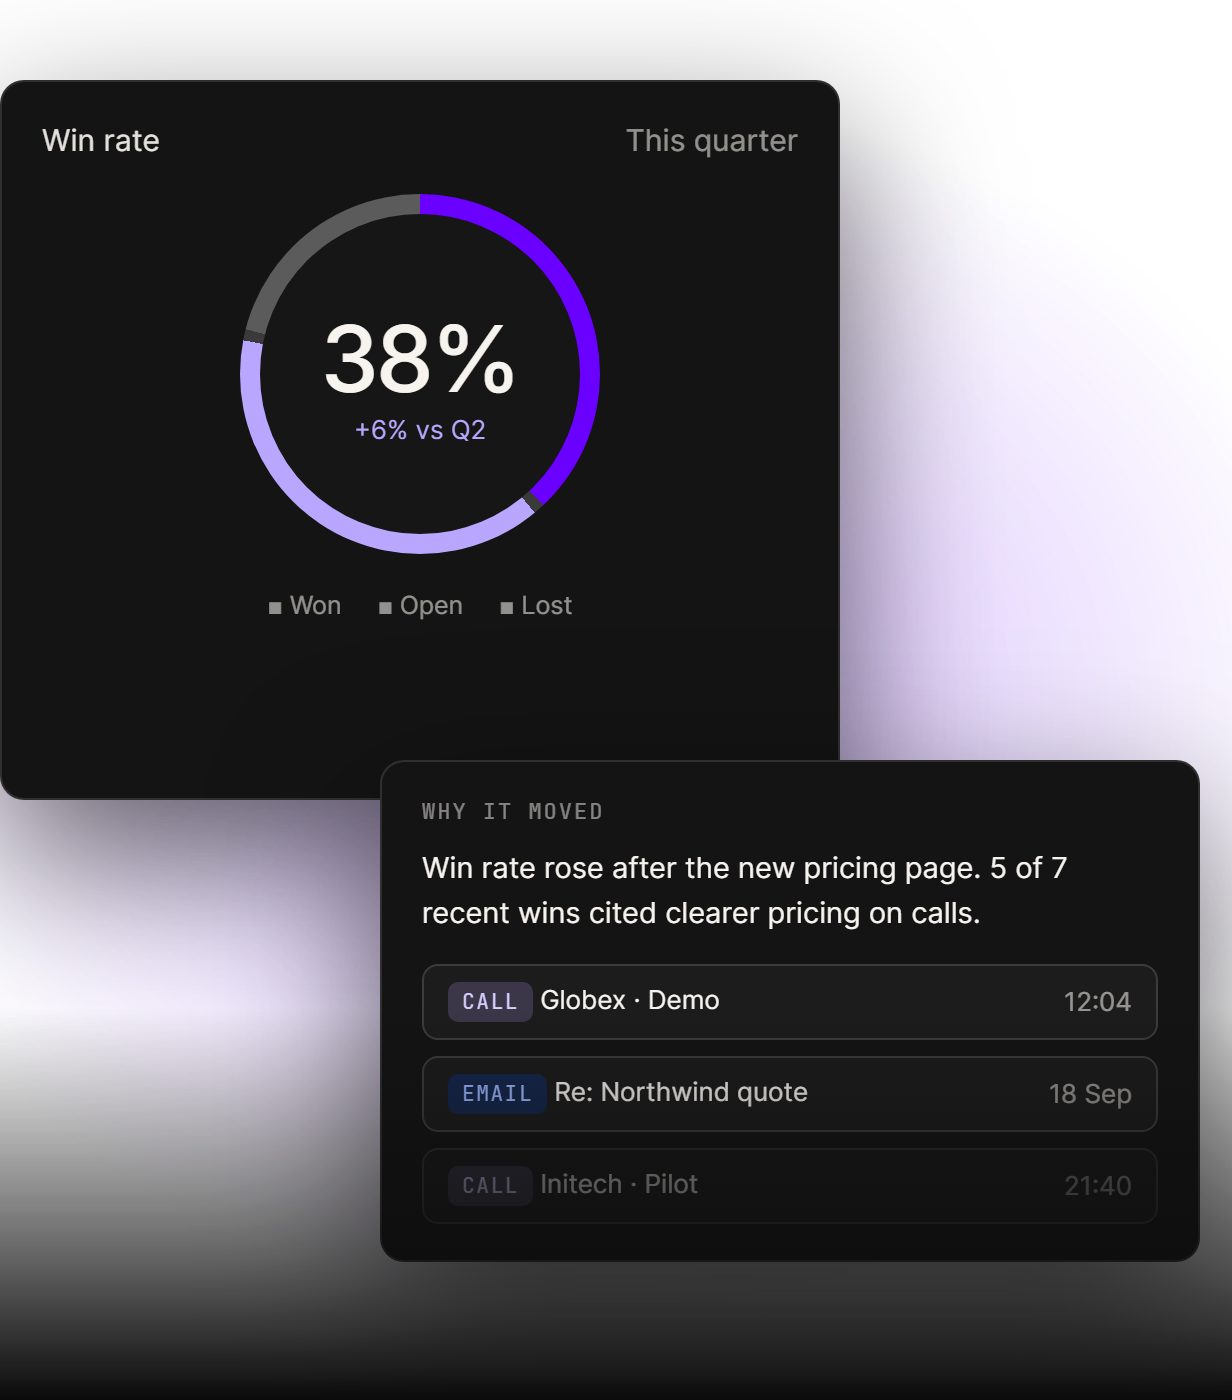
When a widget shows something worth a closer look, ask Rilt what is driving it. Answers cite the deals and conversations behind the number, without leaving the view.
Learn more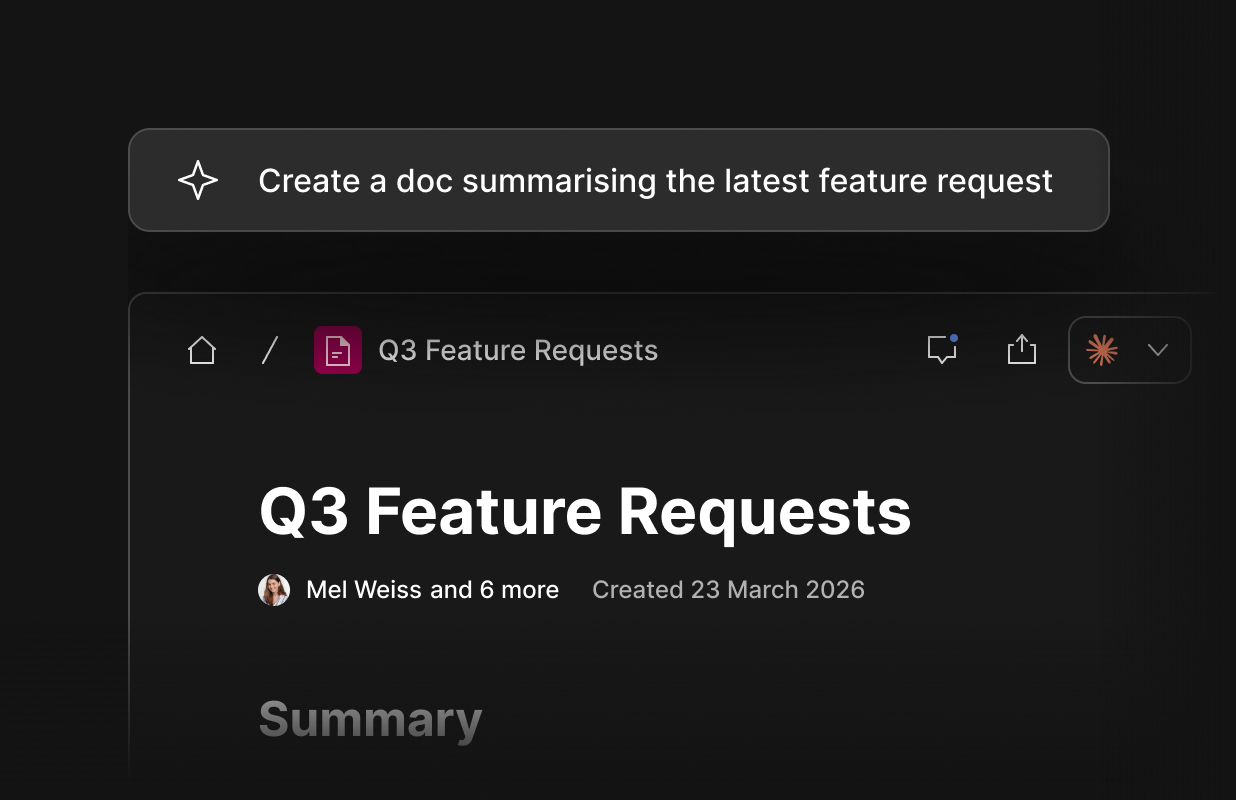
 Docs
Docs
Turn a quarter into a document your team can act on. Draft a pipeline review, forecast note or QBR deck from the underlying data with one prompt.
Learn more
 Agents
Set up agents to watch your dashboards and send summaries to Slack or email, so a slipping forecast or a stalled stage reaches the right people automatically.
Learn moreFAQs
Live, customizable dashboards that show open pipeline value, wins this quarter, stage breakdown, win rate, forecast and the deals closing soonest.
Agents watch the numbers and flag stalled stages, a slipping forecast or big deals going quiet, so you can act before the quarter is at risk.
Yes. Dashboards show where deals move fastest and which accounts are ready to expand, so you can double down on what works.
Open pipeline, wins, stage breakdown, win rate, forecast, deals closing soonest and agent activity, sliced by owner, stage or period. Dashboards are in beta; basic dashboards come with the Free plan and advanced dashboards with Enterprise.